Your numbers don’t add up.
We find out why.
Attribution that doesn’t tie to revenue. Metrics that changed and nobody knows why. Three platforms reporting three different answers for the same period. Before you can trust a dashboard, the data feeding it has to be right — and that work happens before a single chart gets built.
5 days
Typical time to a working data pipeline
1 source
Single database replacing 6 disconnected tools
<8%
Attribution variance after data clean-up
0
Manual spreadsheets left standing at handoff
Bad data doesn't become good data inside a dashboard.
Every dashboard project that fails does so in the same four places. Most vendors skip straight to the visual layer and leave these problems running underneath.
01
Your data sources don't agree on basic facts
Shopify reports different revenue than your payment processor. Your CRM shows different conversions than ad platforms. When sources contradict each other, every dashboard built on top is unreliable — no matter how polished it looks.
Data integrity failure02
Nothing is connected — reports are assembled manually
Your team spends 4–6 hours per week pulling data from 5 different tabs, copy-pasting into a spreadsheet, and hoping nothing breaks. The report is stale the moment it's done and nobody can trace an error back to its source.
No integration layer03
There's no database — data lives in the tools that generated it
Without a central data store, you can't do multi-source joins, historical comparisons, or anything requiring data to be in the same place at the same time. Every cross-channel question becomes a manual project.
No data warehouse04
The dashboard is a vanity tool — nobody acts on it
It was built to look impressive in a board meeting. Nobody knows how to filter it, the numbers don't match what teams track internally, and leadership stopped trusting it six months after launch. It's still running, costing $400/mo.
No data warehouseThree layers. All of them have to work before the dashboard does.
- Layer 01 — Foundation
- Layer 02 — Infrastructure
- Layer 03 — Visibility
- Layer 04 — Ownership
Data Clean-up & Standardization
Before any integration is built, we audit every data source for accuracy, naming conflicts, duplicate records, and broken attribution. We define the single-source-of-truth for each metric your business tracks.
- Source audit: identify contradictions across all data inputs
- Naming standardization across all platforms and schemas
- UTM and tracking parameter cleanup and enforcement
- Historical data backfill where possible
- Data dictionary: every metric defined, with its source & calculation

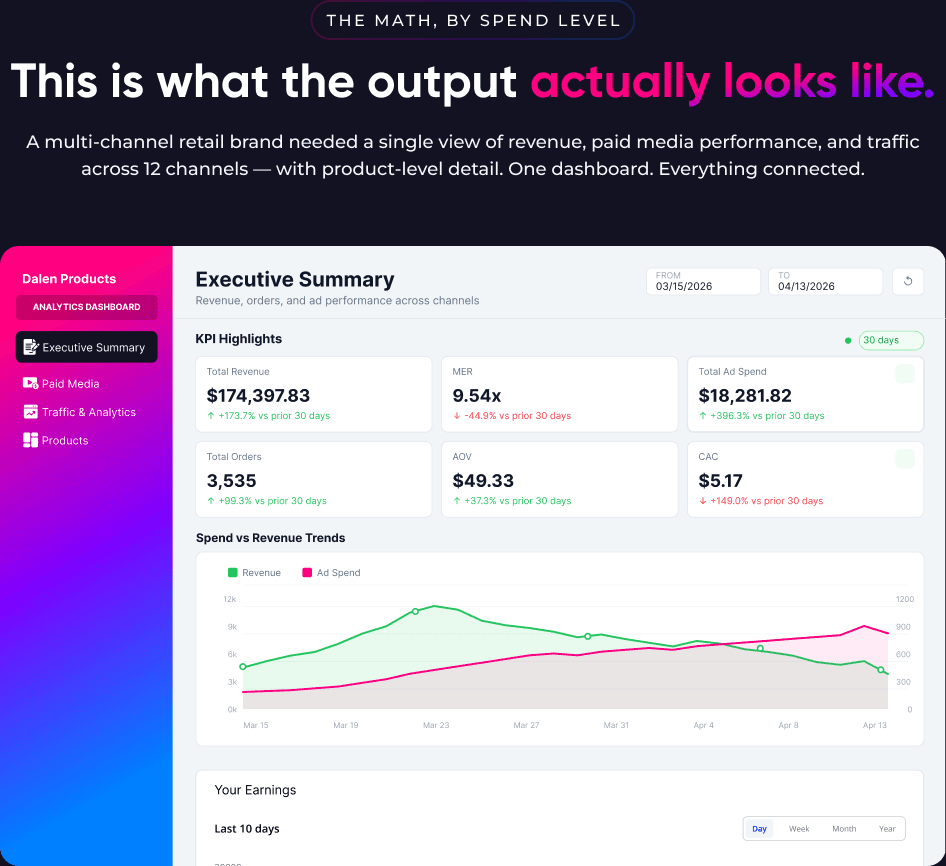
This is what the output actually looks like.
A multi-channel retail brand needed a single view of revenue, paid media performance, and traffic across 12 channels — with product-level detail. One dashboard. Everything connected.
We connect everything. You own the result.
No locked-in SaaS middleware. No proprietary connectors that break when you cancel. We configure real integrations on infrastructure you control.
Stack audit, data layer review, team capability map, opportunity prioritization
Before the engagement. After the handoff.
Every engagement starts with an audit. Here’s what we typically find — and what we leave behind.
Before
- 5–6 hours per week assembling reports manually in spreadsheets
- Three platforms reporting different revenue for the same period
- No cross-channel view — paid, organic, and revenue live in separate tools
- Attribution based on last-click because nothing else is connected
- Historical data lives in CSV exports nobody can find
- Leadership asks questions the team can't answer without a day of pulling data
- Expensive BI tool nobody uses because nobody trusts the numbers
After
- Automated pipeline refreshes data daily — zero manual assembly
- Single source of truth for every metric, with documented calculation
- Executive view shows revenue, ROAS, MER, and channel breakdown in one place
- Multi-touch attribution with incrementality-ready data structure
- Full historical data loaded and queryable from day one
- Any leadership question answerable in under 60 seconds with the live dashboard
- Dashboard your team built trust in because they were part of defining it
How the project actually runs.
Fixed phases. Defined deliverables. No open-ended retainer.
We access all your data sources and document what exists, what's broken, and what's contradicting itself. You receive an audit report with every finding, every discrepancy, and a prioritised fix list. This deliverable is yours regardless of next steps.
We define the database schema based on your reporting needs, fix the data quality issues identified in the audit, and standardise naming, UTMs, and tracking across all sources. All metric definitions are agreed before any infrastructure is built.
We connect all agreed data sources via API, configure the database, build the ETL pipelines, and set up automated refresh schedules. Every integration is tested against the audit findings before we move to the dashboard layer.
We build the dashboard views against the clean, structured data. Each view is reviewed with your team before it's finalised. We iterate until the numbers match what your team expects and every stakeholder understands what they're looking at.
Once the dashboard is live, things change — new channels get added, reporting requirements shift, something breaks after a platform API update. We stay available for changes, additions, and fixes on a retainer or per-request basis. No need to re-engage from scratch every time something needs updating.


Find out exactly how much you're leaving on the table.
Let’s explore how MarketSpire can reduce your costs by up to 70% while boosting your marketing performance.
Fields marked with * are required.